Echinosum
Posts: 604
Joined: 1/28/2021
From: Buckinghamshire, UK
Status: online

|
quote:
ORIGINAL: curtavino
Hi all,
I'm trying to figure out how to best go about this problem:
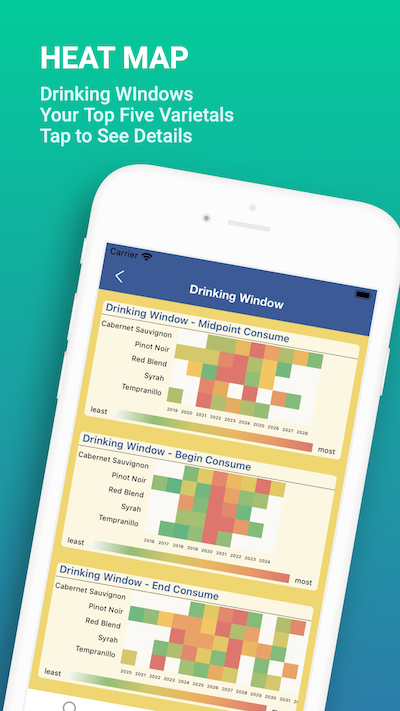
I would like to get a report that shows a drinkability heat-map for my cellar by time. At its simplest, I'm thinking it would show the middle of the drinking window for each wine on the same chart (as a dot, or some sort of histogram bar), so I can see at a glance how well my cellar is stocked for near term (next 3 years), mid term (4 to 10), and long term (10+ years).
First cut would probably just use the Excel dump of my CT data and try to parse the data that way, but eventually if it works, maybe it can be a report available on CT?
Anyway, interested if any of you have ideas or better ways to parse the data to get this. I'm a wires and pliers guy, data analysis is not my wheelhouse.
I think the big issue is when is the drinking window of a given wine. I find a bit of trial and error, in terms of opening bottles, is required. I find merchants often try and persuade you it will be drinkable before in reality it really is: or it may be drinkable but you'd do better to wait.
Before I even joined CT, I made a little spreadsheet of my wine collection to test if I had too much wine for any future year. Because in the past I have got overstocked for certain drinking windows, and ended up keeping stuff
It's not so tricky if you are used to excel, and doing a few sums.
So for my pre-CT effort, I had a line for each wine, showing number of bottles, start year and end year of drinking window. Then I had a cell for each year. As it was a one-off effort, I just manually spread the drinking over the drinking window, with scatters of whole numbers that added up to the total number of bottles, and included provision for a hump of drinking. That involved putting in lots of data, so it isn't really practical except as a one-off effort.
But we can easily download the data out of CT, and build a little formula to spread the drinking. That's the big issue, how do we do that? When we realise it doesn't really matter if the numbers are whole numbers, because we are going to add it up vertically down the years, then such a function becomes more easily designable.
I'd probably just build a little pyramid function, that was zero outside the drinking window, scaled to the width of the drinking window, and scaled to the total number of bottles. Outside the drinking window, the function would be negative, so we can cut that off very easily. Now we have a free parameter, which is how high is the pyramid, in fact probably 2 parameters, as we rescale the slope for different pyramid widths.
I'm probably going to do this sometime, but not today!
If you have your entire wine collection present and easily accessible, now you also have a drinking schedule. My situation is a bit more complicated. I only have space for about 30% of my collection at home, the rest is remote. It has to be delivered in whole cases. Also my pit cellar is very simple, and has to be arranged as things that are easily accessible, and things that are less easily accessible. So I do have a lot of bottles at the back of the cellar that I probably should not have had delivered so early! But the sodding merchants persuaded me it would be drinking. I know better now. Especially with Italian reds....
|
 Printable Version
 Heat map/ histogram / drinkability window ideas? -


 New Messages
 No New Messages
 Hot Topic w/ New Messages
 Hot Topic w/o New Messages
 Locked w/ New Messages
 Locked w/o New Messages
 Post New Thread